Chapter 1
Egypt’s Perspective
The 1979 Israel-Egypt Peace Treaty has had considerable stabilising effects on the Egyptian economy. The end of hostilities with Israel bolstered key sectors of the Egyptian economy that had been severely affected by the conflict with Israel—most importantly, the oil sector (and, later, the gas sector), the Suez Canal and tourism. Additionally, the peace treaty enabled Egypt to receive significant external aid from the United States (US), other Western countries and international organisations including the International Monetary Fund; and it made Egypt a safe market for large-scale foreign private investment. Since the 1980s, these have been the main sources that finance Egypt’s imports and other foreign-exchange expenses.
Comprehensive research in the early 2010s found that the contribution of the oil and gas sectors to Egypt’s balance of payments was $25 billion a year, the equivalent of approximately 45 per cent of Egypt’s total imports of goods and services at that time. The overall contribution of oil and gas, revenues from the Suez Canal, tourism, external aid and foreign investment was roughly equivalent to almost all of Egypt’s imports.[_] These factors also finance large parts of the government budget and contribute more than one-third of Egyptian gross domestic product (GDP).
The growth of the Egyptian economy is expected to become even more dependent on stable relations with Israel in the next decade, given the centrality of the Suez Canal area and East Mediterranean gas fields in Egypt’s economic development strategy. New vulnerabilities and challenges that Egypt is expected to face in the coming decade—most importantly, water shortages—will further highlight the importance of this relationship.
Israel’s Perspective
The effects of the Israel-Egypt Peace Treaty on the Israeli economy were similarly dramatic. The decade that followed the 1973 Yom Kippur War was a period of continuous economic crises for Israel: low economic growth, large budget deficits, high inflation and mounting external debt. Research has found that the huge burden of security costs related to the military conflict with Egypt was a major cause of these crises.[_] Military costs increased significantly after the 1967 Six-Day War, from around 7 per cent of GDP before 1967 to about 20 per cent afterwards, and continued at that high level during the 1969–1970 Israeli-Egyptian War of Attrition and until 1973 (see figure 1). After the 1973 war, military costs jumped to around 30 per cent of GDP.
Israeli Defence Costs as a Percentage of GDP, 1950–2010 (Averages)
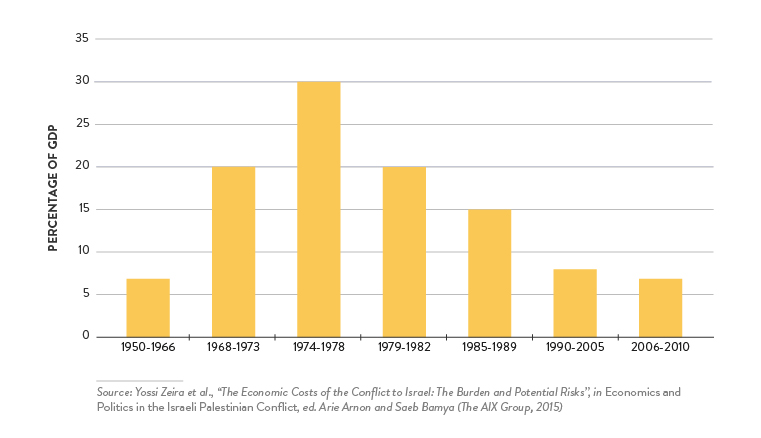
At the end of the 1970s, military expenses dropped back to the post-1967 level of about 20 per cent, and remained at that high level until after the peace treaty with Egypt was implemented in the early 1980s. From that point, there was a steady decline in military expenditure to around 15 per cent of GDP in the second half of the 1980s, to 10 per cent in the early 1990s. By the mid-1990s, defence costs fell below 10 per cent of GDP, and since the late 2000s they have hovered at around 6–7 per cent. That dramatic decrease in defence costs was a major factor in enabling the stabilisation of the Israeli economy in the second half of the 1980s and its impressive performance since the 1990s.[_]
Chapter 2
Israeli Exports to Egypt
Israel’s exports to Egypt were insignificant in the first decade of trade relations, standing at $20–50 million a year between 1994 and 2005, or less than 0.1 per cent of total exports, according to Israeli trade statistics (see figure 2).[_] Israeli exports grew considerably after the Israel-Egypt Qualifying Industrial Zone (QIZ) agreement was set up in the mid-2000s to allow Egypt to benefit from Israel’s free-trade arrangements with the US, to over $200 million a year in 2011–2012, or 0.3–0.4 per cent of total Israeli exports of goods.
Israeli Exports of Goods to Egypt, 1994–2016
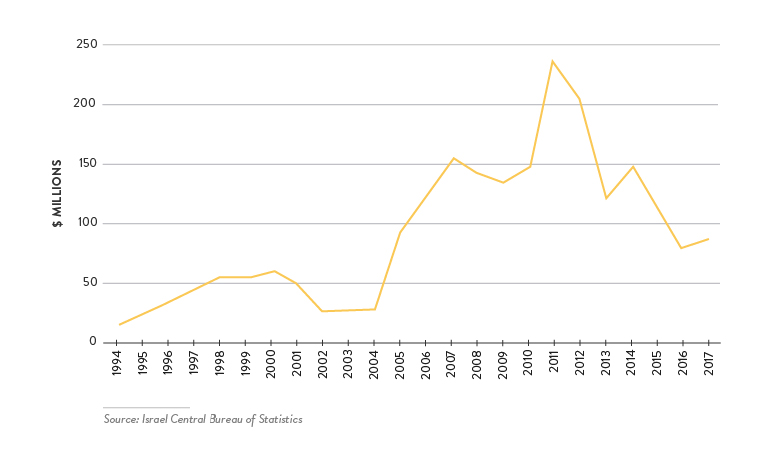
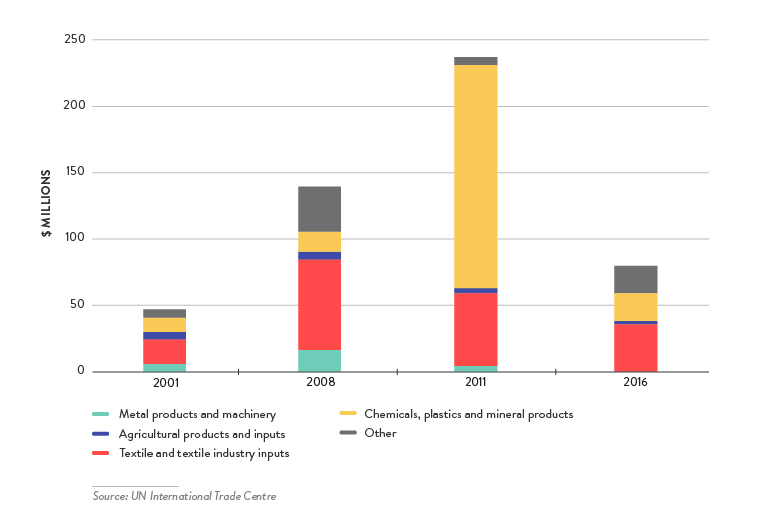
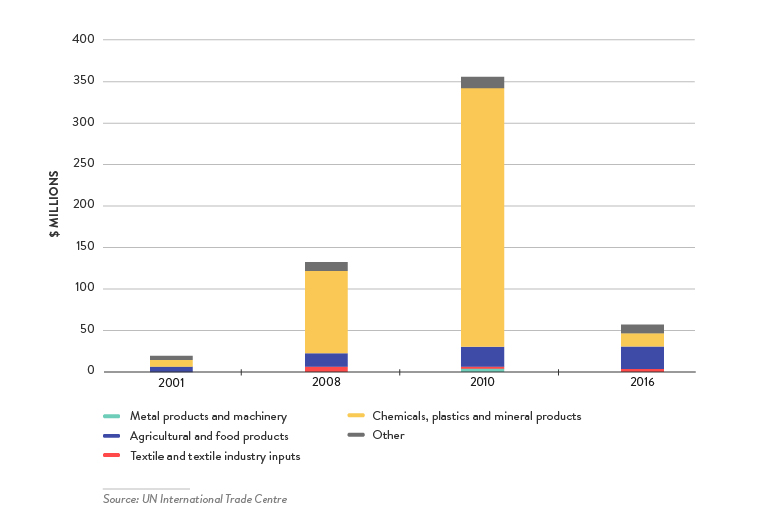
A significant export category that registered substantial growth in that period was chemical and plastics products (see figure 3). Since the early 2010s, however, Israeli exports to Egypt have plummeted, to below $100 million in 2016–2017, or 0.1 per cent of total exports. The main reason for this fall was a steep decline in Egyptian imports of chemicals and plastics from Israel.
Israeli Exports of Goods to Egypt by Category, 2001–2016
Another development in Israeli exports to Egypt is expected in 2019–2020 with Israeli exports of natural gas to Egypt. A deal to sell gas at a value of $1.5 billion a year over ten years was inked in February 2018 by the partners in Israel’s Tamar and Leviathan offshore gas fields and a private Egyptian firm, and more deals are expected.[_]
Israeli Imports From Egypt
Until the early 2000s, most of Israel’s imports from Egypt were oil products. Non-oil products were insignificant, usually amounting to around $20–30 million a year (see figure 4). Total imports, including oil, were worth between $200 million and $350 million a year, equivalent to around 1 per cent of total Israeli imports of goods.
Israeli Imports of Goods From Egypt, 1994–2016
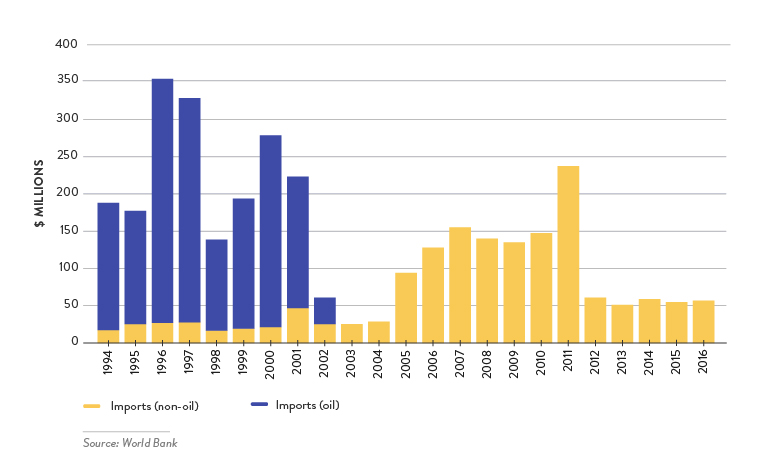
In the second half of the 2000s, oil imports almost stopped and were replaced by gas as Israel’s main import item from Egypt (see figure 5). At an annual volume of $150–250 million a year, imports from Egypt accounted for about 0.5 per cent of total Israeli imports of goods in the second half of the 2000s.
Israeli Imports of Goods From Egypt by Category, 2001–2016
Then, as gas imports from Egypt stopped in the early 2010s, the total value of Israeli imports from Egypt fell to around $50 million a year in 2011–2016.[_] Imports of chemicals, plastics and mineral products declined to $15 million in 2016, reflecting mainly the stoppage of gas exports from Egypt to Israel. What remained was a small volume of various chemical and plastics products. Imports of agricultural and food products continued at around $20–30 million a year, and all other imports combined at around $20 million.
Chapter 3
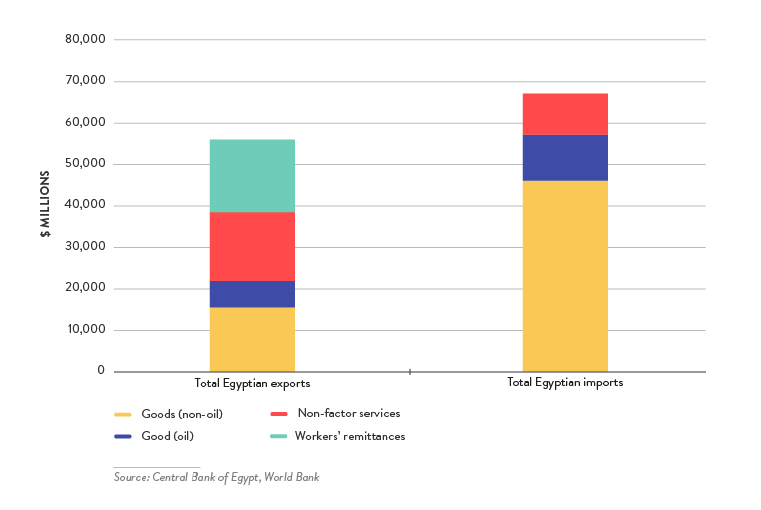
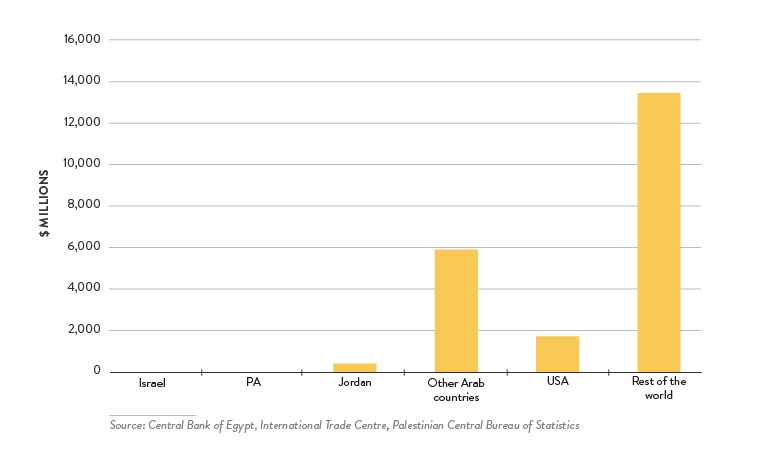
Since 2016, Egypt’s trade with Israel has been virtually insignificant compared with Egypt’s trade with the rest of the world (see figures 6 and 7). Israel’s share in Egypt’s total exports of goods in 2016 was 0.3 per cent, and its share in Egypt’s imports of goods was 0.1 per cent. The share of the Palestinian Authority (PA) in Egypt’s exports of goods was as low as Israel’s (0.3 per cent), with no imports from the PA to Egypt. Jordan’s share was higher, accounting for 2.2 per cent of Egypt’s exports and 0.2 per cent of Egypt’s imports. Nevertheless, Jordan’s portion is dwarfed by Egypt’s trade with other Arab partners, which made up 27 per cent of Egypt’s exports and 18 per cent of Egypt’s imports of goods in 2016.
Egypt’s External Trade by Category, 2016
Egypt’s Exports of Goods by Trading Partners, 2016
Chapter 4
In 1996, the US Congress established the Qualifying Industrial Zone (QIZ) initiative to support the peace process in the Middle East. The QIZ allows Egypt and Jordan to export products to the US duty free, as long as these products contain inputs from Israel. On 14 December 2004, the Egyptian government signed the QIZ Protocol with the US and Israel. This protocol allows duty-free entry into the US for products manufactured by qualified companies operating in designated locations in Egypt.
For an Egyptian QIZ item to be eligible for duty-free entry into the United States, QIZ factories must add at least 35 per cent to the value of the article. This added value can include costs incurred in Israel, Egypt or the US. Egypt and Israel have agreed that each must contribute at least one-third of the 35 per cent minimum content (11.7 per cent of the total). However, the Israeli content requirement was lowered to 10.5 per cent in October 2007.
Through this arrangement, Egypt explicitly aimed to safeguard its textile industry and exports against new and highly risky developments in the global textile market, and to advance Egyptian textile exports to the US. From the Israeli point of view, the aim was to open a new market—Israeli exports of inputs to the Egyptian textile industry—without expecting significant Israeli investments in the Egyptian QIZs. This proved to be a great economic success.
The textile industry has traditionally been the most important manufacturing industry in Egypt. As of 2004 it employed about 1 million workers and represented a quarter of all industrial manufacturing production (excluding oil and gas). Textiles have also been a leading export industry, with total exports in the early 2000s of close to $1 billion a year; half of that was exported to the US. Until the end of 2004, Egyptian textile exports to the US were protected by the US quota regime on imports from China, Turkey and other global leaders in textiles. Since 2005 this regime has been phased out under a new international agreement, and Egyptian exports to the US have been exposed to global competition.
The Israeli-Egyptian QIZ agreement was designed to protect Egyptian exports to the US from the new global competition and enhance these exports by enabling Egyptian textile exports produced in the QIZs to enter the US market duty free. That was expected to put Egypt in an advantageous position compared with other textile-exporting countries.
With this aim in mind, the Egyptian qualifying zones were broadly defined, to include all major industrial areas: Greater Cairo, Alexandria, the Middle Delta governorates and the Suez Canal area. These broad QIZs include dozens of large industrial sites, which host most of Egypt’s textile and garment plants. Hence, hundreds of textile and garment companies, which were already exporting to the US, were included—immediately and almost automatically—in the new QIZ arrangement. About 400 companies qualified as soon as the QIZ agreement was signed. This number increased constantly and by the end of 2011 had reached 820. By the end of 2016, the number of qualified companies in the Egyptian QIZ system had increased to 961.[_]
The achievements of the QIZ arrangement were remarkable. The total value of textile and garment exports from the QIZ plants in 2006—the first full year of implementation—increased from about $500 million a year before the introduction of the QIZ to $636 million afterwards. Exports continued to show constant growth, regardless of political upheavals in Egypt, and registered a record of $934 million in 2011. Since then, no further growth in QIZ exports has been recorded, and the level remained stable at around $850–900 million over 2012–2015.[_]
Because the QIZ agreement demanded that Egyptian goods exported to the US contain at least 11.7 per cent of Israeli added value (reduced to 10.5 per cent in October 2007), Israeli exports of textile-related categories to Egypt grew in line with the growth of Egyptian exports to the US. Israeli exports of textile-related products more than tripled in the first years after the application of the QIZ agreement in 2005, to $68 million in 2008. Since then, the level has registered a steady decline—to $55 million in 2011 and $35 million in 2016.
Chapter 5
The Israeli-Egyptian gas deal signed in February 2018 shows the large potential of Israeli-Egyptian trade and cooperation in this field. Direct exports of gas from Israel to Egypt are expected to reach $1.5 billion a year in the 2020s—20 times higher than total Israeli exports to Egypt in recent years.
The potential for cooperation in re-exports to third markets, and industrial processing of natural gas, may be even larger. Egypt’s long-term strategic development aim is to make the country a hub where East Mediterranean gas from Egyptian, Israeli and other fields will be processed and exported to European and other third markets. Additionally, Cairo aims at large-scale development of chemical and plastics industries as one of the pillars of its industrial development strategy. Israel, as a supplier of gas and a leader in the advanced-plastics industry, can be an important partner in that objective.
Given the size of Egypt’s economy and population, and its large needs in water technologies, energy, agriculture and other fields in which Israel has a clear comparative advantage, the trade potential between Israel and Egypt in these fields may be large as well.